NDVI Feature in Smart Farming
Normalized Difference Vegetation Index · Satellite Crop Health Monitoring
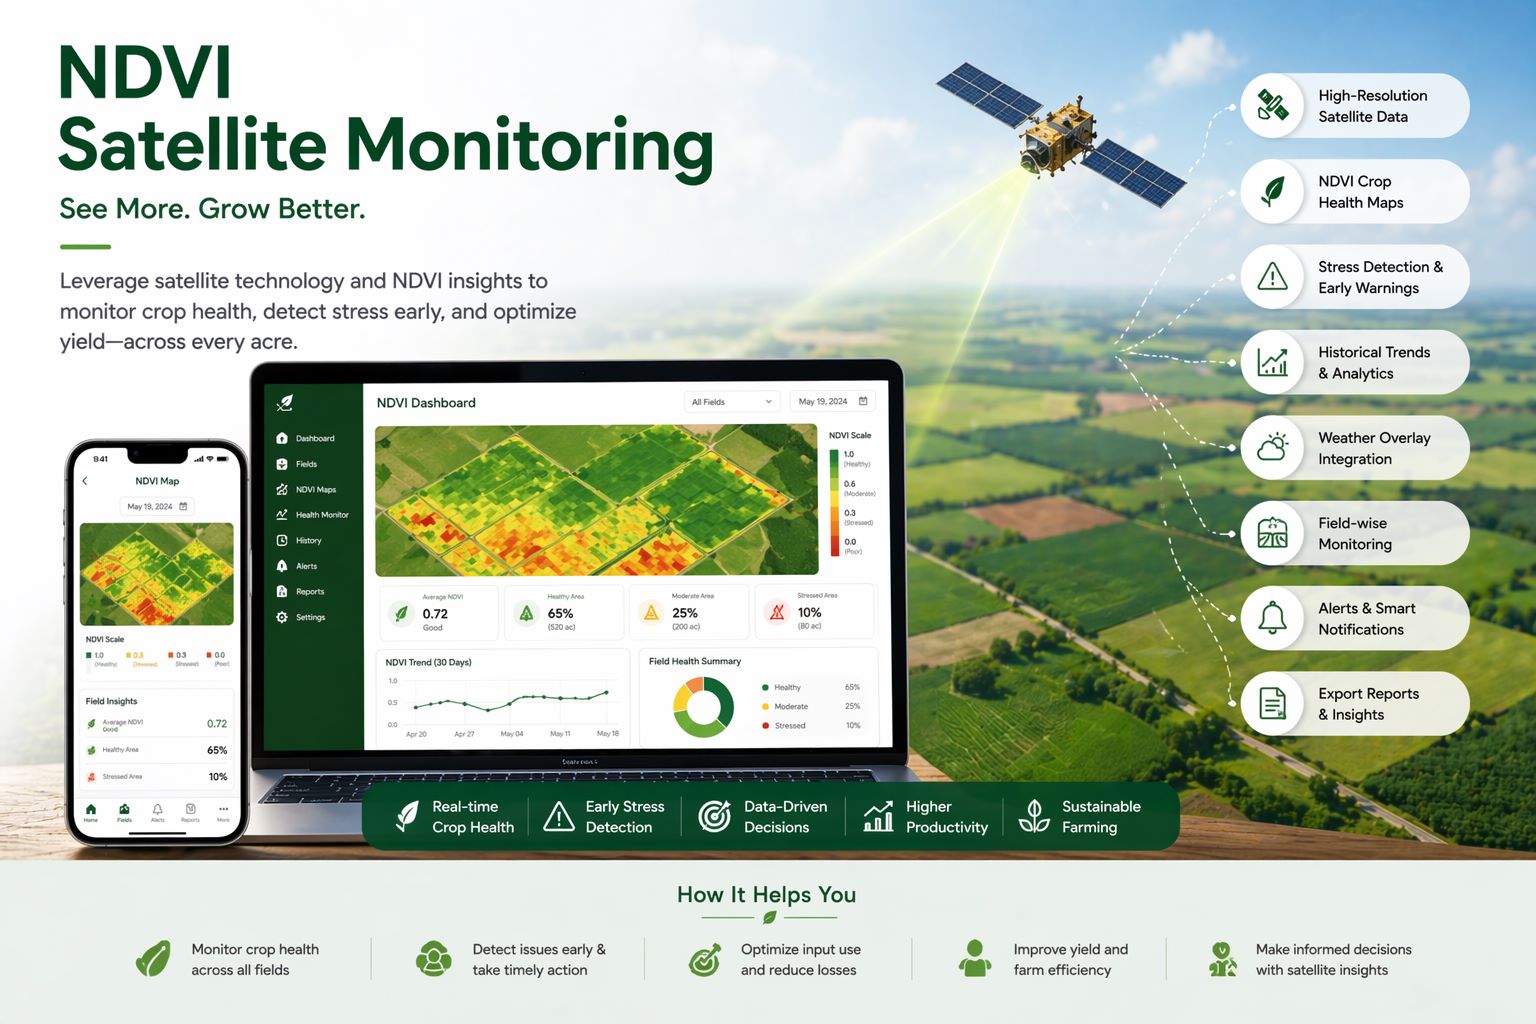
What is NDVI?
NDVI (Normalized Difference Vegetation Index) is a satellite-based technology that measures crop health using infrared and red light reflection from plants. Healthy crops reflect more infrared light — this difference is converted into a vivid color-coded map that shows exactly where crops are thriving and where they are under stress — visible from space.
Key NDVI Features
Historical Comparison
Compare NDVI maps week-by-week or season-by-season to track crop health changes and spot recurring problem zones
Early Stress Detection
Detects crop stress 2–3 weeks before it is visible to the naked eye — giving farmers time to act before yield is lost.
Irrigation Zoning
Identifies dry zones in the field so farmers can direct water precisely where needed — saving water and improving yield.
Fertilizer Optimization
Low NDVI zones indicate nutrient deficiency — helping farmers apply fertilizers only where needed, cutting cost and waste.
Yield Prediction
Based on NDVI trends, the app estimates expected yield before harvest so farmers can plan storage and sales in advance
Satellite Updates
NDVI maps are refreshed every 5–10 days using data from free satellites like Sentinel-2 and Landsat — no extra cost.
Why It Matters
A farmer cannot walk every inch of a large field daily. NDVI gives a complete bird’s-eye health report of the entire farm in seconds — from space!